After more than six months, and more than a few technical hurdles, NYTProf v3 has been released at last.
In this post I’ll review the major changes and significant new features.
What’s new in Devel::NYTProf v3?
Treemap
The first big feature is a visualization of the exclusive time spent in subroutines represented as a treemap:
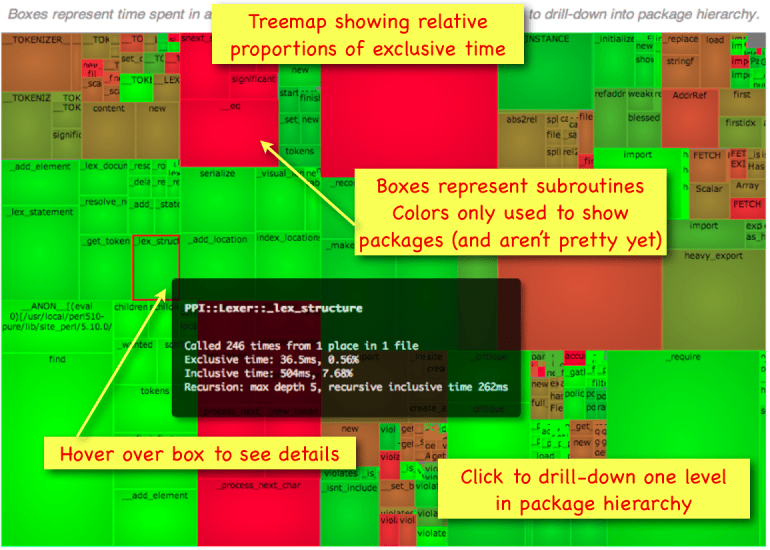
That’s a treemap of a profile of perlcritic 1.088. The colors don’t mean anything. They’re just used to visually group subroutines in the same package. (I’m not very happy with the colors but the JIT toolkit I’m using doesn’t make it easy to use an attractive colour range. It interpolates a value in RGB color space. It would be much better to interpolate the value in HSV color space.)
The treemap is interactive! If you click on a square then the treemap is redrawn “zoomed in” one package level ‘closer’ to the package of the subroutine you clicked on.
Subroutine Caller Tracking
The subroutine profiler has been almost completely rewritten, yielding another major new feature. It now finds and records the name of the calling subroutine. (You might have assumed that NYTProf always did that. In fact it guessed based on the calling file and line number, and so was easily confused by nested subroutines and closures.) By properly tracking the calling subroutine NYTProf can now generate a more accurate call graph.
One immediate beneficiary is the nytprofcg utility (contributed by Chia-liang Kao). nytprofcg reads NYTProf profile data and generates callgrind data for viewing via Kcachegrind. The previous guessing behaviour limited the usefulness of nytprofcg. Now it works well, as you can see here:

I’ve not played with it much yet. If you do, let us know how it works out for you!
The subroutine called main::RUNTIME in the image above is the fake name that NYTProf gives to ‘caller’ of the main script code. Code run at compile time will have a top-level caller of main::BEGIN.
BEGIN
Speaking of BEGINs, they’ve always been a problem because there can be many of them in a single package. Each use statement, for example, generates a BEGIN sub that’s immediately executed then discarded. Previously the data for all those BEGINs was mashed together and so almost useless.
The NYTProf subroutine profiler now renames BEGINs by appending @linenumber to make them unique. A whole new level of detail is opened up by this change. (This, along with a few other new features, requires perl 5.10.1+ or 5.8.9+.)
Goto
NYTProf now handles goto ⊂ properly. That tail-call construct is commonly found at the end of AUTOLOAD subroutines—so it’s more common than you might think.
The calling and called subroutine call counts and timings are updated correctly. For the call graph, the destination subroutine appears to have been called by the subroutine that called the subroutine that executed the goto. In other words, if A calls B and B does a goto &C, that call to C will show A as the caller. That fits the way goto &sub works, and ensures inclusive and exclusive times make sense.
Slow Opcode Profiling
This is another major new feature. NYTProf can now profile the time spent executing certain opcodes (the lowest-level units of execution in the perl interpreter).
I originally envisaged adding the mechanism for opcodes that corresponded to system calls (read, write, mkdir, chdir etc.) and called the feature ‘sys ops’. Then I realised there were other perl opcodes that would be worth profiling. The main two being match (m/.../) and subst (s/.../.../). So now the NYTProf subroutine profiler can now profile time spent in regular expressions!
Here’s an example:

The opcodes are given pseudo-subroutine names in the package that invoked the opcode with “CORE:” prepended to the opcode name. In the example above you can see two instances of CORE:match. One accounting for matches performed in the main:: package, and another accounting for matches performed in the File::Find:: package. (They’re marked ‘xsub’ above but I’ve changed that to ‘opcode’ now.)
Profiling of ‘slowops’, as I’ve called them, is controlled by the slowops=N option. A value of 0 turns off slowop profiling. A value of 2 (the default) gives the behaviour shown above, with opcodes called in different packages being accounted for separately. A value of 1 will put all the slowops into a single package named “CORE::“.
GraphViz
Another spin-off from the work on call graphs: NYTProf now also outputs representations of the subroutine call graph as GraphViz dot language files. These can be rendered by
a variety of viewers. I use GraphViz by pixelglow.
Here’s a simple example showing the calling relationship between packages in a little demo script I use for testing:

The dot file for that inter-package view is available as a link on the top-level index page of the report.
On the individual report pages for each source file there’s a link to another dot file. This one shows the calls into, out of, and between the subroutines in package(s) in that source file. For example, here’s the call graph for the subs in the File::Find module:

There are many things that could be improved with that graph, such as adding call counts. Overall though, I’m pretty happy with it.
Report Format Changes
There have been some changes to the main report columns:
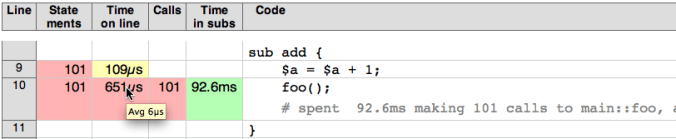
There are two new columns, “Calls” and “Time in Subs”. They show the number of subroutine calls executed on that line, and the total time spent in those subroutines due to those calls. Both are color coded, relative to the other values in the same columns, using the same Median Average Deviation that’s used elsewhere.
To make room for the new columns, the column showing the average statement execution time has been removed (it wasn’t much use anyway) and the column headings tightened up. The average value, if you’re interested, is available as a tool-tip, as shown above.
New Options
A few new options have been added, including:
sigexit=SSome signals will abort a process leaving a corrupt profile data file. Thesigexitoption can be used to tell NYTProf to catch those signals and close the profile cleanly before exiting.forkdepth=NWhen a process being profiled is forked the child process is also profiled. Theforkdepth=Noption can be used to limit the number of generations that are profiled. The default is -1 (all generations). A value of 0 effectively disables profiling of child processes.log=FIf you enable NYTProf trace output, via thetrace=Noption, it’s normally written to stderr. Thelog=Fcan be used to write the log to a specific file instead.
nytprofmerge
As I mentioned above, when a profiled process forks, the child is also profiled, with the profile being written to a new file. So processes which have many children, like mod_perl, end up with many profile data files. Naturally many people have expressed a wish for NYTProf to be able to merge multiple profiles into a single report. Sadly no one has stepped up actually do the work, till now.
Nicholas Clark, who contributed the great zip compression for v2.04 (and a major contributor to the perl core and pumpkin for the 5.8.2+ releases) has come up trumps again. NYTProf v3 includes a new nytprofmerge utility that’ll read multiple profiles and write out a new, merged, profile. It’s very new, and somewhat experimental, but answers a very real need. Give it a whirl and let us know how it goes.
Screencast
I gave a talk on Devel::NYTProf at the (excellent) Italian Perl Workshop in October. I covered both the features in version 3 and the phased approach I take to optimizing perl code. You can watch the screencast.
And finally
For more information on the changes in Devel::NYTProf v3 you can read the Changes file.
It’s Christmas Eve here in Ireland. After days, and nights, of hard frost the countryside is spectacularly encased in tiny ice crystals sparking in the bright sunshine. I’m delighted to have stumbled into working on NYTProf. It’s a great project at the intersection of two of my professional passions: performance and visualization. And I’m delighted to give you NYTProf v3 in time for this Christmas.
Enjoy!
Tim.

Thank you for all your hard work Tim! I look forward to using all these shiny new tools. Merry Christmas!
These are great features. Installing as I type…
Ideally, tools for effective programming should be so much fun to work with that programmers can’t wait for an excuse to include them in their programming discipline. Looks like you’ve done it. cool.
Awesome. Truly awesome.
Wow. And just the perfect timing as I am profiling AI::NeuralNet::SOM over Xmas.
Wow, again. :-)
\rho
Pingback: Choosing a Java profiler | web hosting india, web hosting in india, web hosting company india, india web hosting
Tim strikes again! :-) Awesome new features. I look forward to getting some time to profile our $work application.
First off, thanks again. The module is excellent and we are making great use of it.
Second, we are running into trouble regarding memory usage of our applications. There are different ways to do this and I am aware that it is outside the scope of Devel::NYTProf, but would there be a simple way to pinpoint code which causes massive memory usage?
It’ll probably happen one day. Search http://groups.google.com/group/develnytprof-dev/ for ‘memory’
Pingback: Polishing NYTProf « Not this…
Pingback: NYTProf v4 – Now with string-eval x-ray vision! « Not this…
Pingback: java2perl6api – Java to Perl 6 API tranalation – What, Why, and Whereto « Not this…
Pingback: Resource on debugging, profiling and benchmarking in Perl « ppant's blog