NYTProf v5 – Flaming Precision

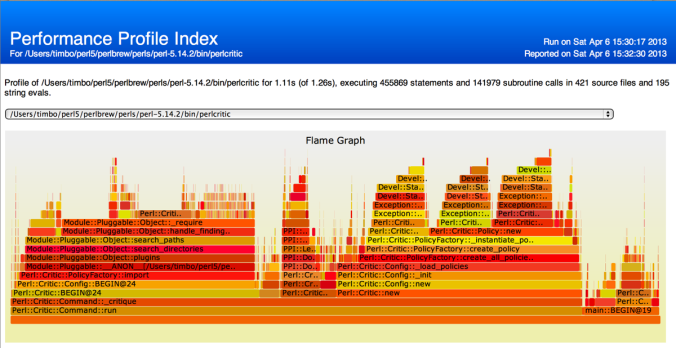
As soon as I saw a Flame Graph visualization I knew it would make a great addition to NYTProf. So I’m delighted that the new Devel::NYTProf version 5.00, just released, has a Flame Graph as the main feature of the index page.

nytprof-v5-flamegraph.png

In this post I’ll explain the Flame Graph visualization, the new ‘subroutine calls event stream’ that makes the Flame Graph possible, and other recent changes, including improved precision in the subroutine profiler. Continue reading

Introducing Devel::SizeMe – Visualizing Perl Memory Use

For a long time I’ve wanted to create a module that would shed light on how perl uses memory. This year I decided to do something about it.

My research and development didn’t yield much fruit in time for OSCON in July, where my talk ended up being about my research and plans. (I also tried to explain that RSS isn’t a useful measurement for this, and that malloc buffering means even total process size isn’t a very useful measurement.) I was invited to speak at YAPC::Asia in Tokyo in September and really wanted to have something worthwhile to demonstrate there.

I’m delighted to say that some frantic hacking (aka Conference Driven Development) yielded a working demo just in time and, after a little more polish, I’ve now uploaded Devel::SizeMe to CPAN.

In this post I want to introduce you to Devel::SizeMe, show some screenshots, a screencast of the talk and demo, and outline current issues and plans for future development. Continue reading

NYTProf v4 – Now with string-eval x-ray vision!

I released Devel::NYTProf v3 on Christmas Eve 2009. Over the next couple of months a few more features were added. The v3 work had involved a complete rewrite of the subroutine profiler and heavy work on much else besides. At that point I felt I’d done enough with NYTProf for now and it was time to focus on other more pressing projects.

Over those months I’d also started working on enhancements for PostgreSQL PL/Perl. That project turned into something of an epic adventure with more than its fair share of highs and lows and twists and turns. The dust is only just settling now. I would have blogged about it but security issues arose that led the PostgreSQL team to consider removing the plperl language entirely. Fortunately I was able to help avoid that by removing Safe.pm entirely! At some point I hope to write a blog post worthy of the journey. Meanwhile, if you’re using PostgreSQL, you really do want to upgrade to the latest point-release.

One of the my goals in enhancing PostgreSQL PL/Perl was improve the integration with NYTProf. I wanted to be able to profile PL/Perl code embedded in the database server. With PostgreSQL 8.4 I could get the profiler to run, with some hackery, but in the report the subroutines were all __ANON__ and you couldn’t see the source code, so there were no statement timings. It was useless.

The key problem was that Devel::NYTProf couldn’t see into string evals properly. To fix that I had to go back spelunking deep in the NYTProf guts again; mostly in the data model and report generation code. With NYTProf v4, string evals are now treated as files, mostly, and a whole new level of insight is opened up!

In the rest of this post I’ll be describing this and other new features.

Continue reading

NYTProf 2.09 – now handles modules using AutoLoader, like POSIX and Storable

I’ve uploaded Devel::NYTProf 2.09 to CPAN.

If you’re using VMS the big news is that Peter (Stig) Edwards has contributed patches that enable NYTProf to work on VMS. Yeah! Thanks Peter.

For the rest of us there’s only one significant new feature in this release: NYTProf now includes a heuristic (that’s geek for “it’ll be wrong sometimes”) to handle modules using AutoLoader. The most common of which are Storable and POSIX. You may have encountered a warning like this when running nytprofhtml:

Unable to open '/../../lib/Storable.pm' for reading: No such file or directory

It’s a symptom of a deeper problem caused by AutoSplit, the companion to AutoLoader. The details of the cause, effect, and fix aren’t worth going into now. If you’re interested you can read my summary to the mailing list.

The upshot is that NYTProf now reports times for autoloaded subs as if the sub was part of the parent module. Just what you want. Time spent in the AUTOLOAD’er sub is also reported, naturally.

There is a small chance that the heuristic will pick the wrong ‘parent’ module file for the autoloaded subroutine file. That can happen if there are other modules that use the same name for the last portion of the package name (e.g., Bar::Foo and Baz::Foo). If it ever happens to you, please let me know. Ideally with a small test case.

The list of changes can be found here (or here if you’re a detail fanatic).

One other particularly notable item is that the savesrc option wasn’t working reliably. Thanks to Andy Grundman providing a good test case, that’s now been fixed.

Enjoy!

NYTProf screencast from the 2008 London Perl Workshop

I’ve uploaded the screencast of my NYTProf talk at the London Perl Workshop in November 2008.

It’s based on a not-quite-2.08 version and includes some coverage of an early draft of the ‘timings per rolled-up package name’ feature I discussed previously.

It also shows how and why anonymous subroutines, defined at the same line of different executions of the same string eval, get ‘merged’.

The demos use perlcritic and Moose code. It also includes a nice demonstration showing NYTProf highlighting a performance problem with File::Spec::Unix when called using Path::Class::Dir objects.

It’s 36 minutes long, including a good Q&A session at the end (wherein a market rate for performance improvements is established). Enjoy.

NYTProf 2.08 – better, faster, more cuddly

I’ve just released NYTProf 2.08 to CPAN, some three and a half months after 2.07.

If you’ve been profiling large applications then the first difference you’ll notice is that the new version generates reports much faster.

NYTProf 2.08 timings.pngThe next thing you may notice is that statement timings are now nicely formatted with units. Gisle Aas contributed the formatting code for 2.07 but I had to do some refactoring to get it working for the statement timings.

Another nice refinement is that hovering over a time will show a tool-tip with the time expressed as a percentage of the overall runtime.

Almost all the tables are now sortable. I used jQuery and the tablesorter plugin for that. I’ve not added any fancy buttons, just click on a table heading to sort by that column. You’ll see a little black arrow to show the column is sorted. (You can hold the shift key down to add second and third columns to the sort order.)

A profiler isn’t much use if it’s not accurate. NYTProf now has tests for correct handling of times for string evals within string evals. In fact the handling of string evals got a big overhaul for this version as part of ongoing improvements in the underlying data model. I’m working towards being able to show annotated performance reports for the contents of string evals. It’s not there yet, but definitely getting closer.

A related feature is the new savesrc=1 option. When enabled, with a recent version of perl, the source code for each source file is written into the profile data file. That makes the profile self-contained and, significantly, means that accurate reports can be generated even after the original source files have been modified.

Another new option is optimize=0. You can use it to disable the perl optimizer. That can be worth doing if the statement timings, or counts, for some chunk of code seem odd and you suspect that the perl optimizer has rewritten it.

The final new feature noted in the NYTProf 2.08 Changes file is that it’s now possible to generate multiple profile data files from a single application. Since v2.0 you could call DB::disable_profile() and DB::enable_profile() to control profiling at runtime. Now you can pass an optional filename to enable_profile to make it close the previous profile and open a new one. I imagine this would be most useful in long running applications where you’d leave profiling disabled (using the start=none option) and then call enable_profile and disable_profile around some specific code in specific situations – like certain requests to a mod_perl app.

There’s one more new feature that I’ve just realised I’d forgotten to add to the Changes file before the release: Timings per rolled-up package name. What’s that? Well, it’s probably easiest to show you…

These images are taken from a profile of perlcritic. Each shows the time spent exclusively in subroutines belonging to a certain package and any packages below it. Hovering over a time gives the percentage, so I can see that the 57.3s spent in the 36 PPI packages accounted for 42% of the runtime.

NYTProf 2.08 pkg1.png

This gives you a quick overview for large (wide) codebases that would be hard to get in any other way.

Tables are generated for upto five levels of package name hierarchy, so you can drill-down to finer levels of detail.

NYTProf 2.08 pkg2.png


NYTProf 2.08 pkg3.png

I can visualize a much better UI for this data than the series of tables nytprofhtml currently produces, but my limited free time and jQuery skills prevent me doing more. Patches welcome, naturally.

Enjoy!

p.s. I’ve a screencast from my NYTProf talk at the London Perl Workshop in November I hope to (finally) upload soon. It includes a demo of the package roll-up timing tables.

NYTProf 2.07 – Even better, and now for Windows too

NYTProf development rolls on, with 2.07 being another significant release.

Here’s a summary of highlights from the many improvements.

Windows, at last

Windows wizard Jan Dubois has contributed patches that enable NYTProf to run on Windows. Many thanks Jan!

Corrected Subroutine Total Time

A significant error in time reported as spent in a subroutine has been fixed. It was showing the sum of the inclusive and exclusive time instead of just the inclusive time.

String Evals

One of NYTProf’s innovative features is tracking of subroutine calls by calling location. In earlier versions you couldn’t see calls made from within string evals. Now you can. Even for evals within evals:

NYTProf string eval.png

That’s a big step forward for profiling code that makes heavy use of evals.

(The use of the µ micro symbol is also new – part of some helpful interface polishing contributed by Gisle Aas. They’re not used on the statement timings yet, but will be at some point.)

Recursion

Previously the ‘inclusive time’ reported for a subroutine wasn’t useful for subroutines called recursively. The overall inclusive time included the inclusive time of nested calls, typically inflating it beyond usefulness.

Now the inclusive time only measures the inclusive time of the outermost calls. NYTProf now also tracks and reports the maximum call depth for each calling location.

Disabling the Statement Profiler

NYTProf started life as a statement profiler. I added a subroutine profiler later and was delighted with how well that worked out. The subroutine profiler is novel in a few ways and also extremely robust and efficient. Part of the efficiency comes from not streaming data to disk while the program is running. It accumulates the counts and timings in memory.

When profiling large and/or performance sensitive applications the costs of NYTProf’s statement profiler, in performance impact and disk space, can be prohibitive. So now I’ve added an option to disable the statement profiler. Setting the stmts=0 option turns NYTProf into a very lightweight subroutine profiler.

Caller Information for XSubs

NYTProf reports time spent in subroutines broken down by calling location. It’s one of its key features. The caller details are embedded as comment annotation into the report for each perl source code file.

That has worked very well for perl subs, but there’s no natural home for XS subroutines because there was no source code file available to annotate.

There’s a partial solution included in NYTProf 2.07: XS subs that are in the same package as profiled perl subs, get annotated subroutine ‘stubs’ appended to the report for the corresponding perl source file.

It works quite well, in particular the common UNIVERSAL methods get annotated:

NYTProf xsub callers.png

Also, now these subs have a place in the reports, any references to them are hyper links, naturally.

Sadly it doesn’t work so well for packages that don’t contain any perl subs, like DBI::st. I plan to add per-package report pages for them in a future release.

Clock Docs

I’ve greatly expanded the description of the various clocks available for profiling: POSIX real-time clocks, gettimeofday(), and Time::HiRes.

I’ve also added a caveats section that discusses issues with SMP systems, processor affinity, and virtual machines.

Feedback Wanted

How has NYTProf helped you optimize your applications? Let me know.

Perhaps as blog posts of your own, linking back here, or comments here, or CPAN ratings, or email to the mailing list or just to me. I’d love to hear from you.

Thanks!
NYTProf 2.05 – assorted fixes

Hot on the heels of NYTProf 2.04, I’ve just released NYTProf 2.05. It has a few small but significant bug fixes. From the Changes file:

  Fixed alteration of $! during profiling, thanks to Slaven Rezic.
  Fixed clock_gettime() clock selection to fallback to CLOCK_REALTIME
    if CLOCK_MONOTONIC is not available, e.g, on linux 2.4.
  Fixed error when application ends after DB::disable_profile().
  Added some docs to Devel::NYTProf::Apache
  Added clock=N option to enable user to select the clock.

All the bugs were long-standing ones that happened to come to light and get fixes after 2.04 was released.

The first was the cause of a couple of odd bugs were applications would behave differently when profiled. The problem was that in certain situations the profiler would alter the value of $! between statements, so code that tested for $! would think something had gone wrong.

The second caused weird timing values on some platforms. The statement times would be zero and the subroutine times would be garbage. The problem was that some systems, such as Linux 2.4, define the CLOCK_MONOTONIC macro but don’t implement that clock in the kernel. NYTProf wasn’t testing that the clock worked. Now it does. If the clock_gettime() call fails with the selected clock it falls back to CLOCK_REALTIME (and if that fails NYTProf aborts).

As a bonus I’ve added the ability to select what clock you want to use by setting clock=N in the NYTPROF environment variable, where N is the integer id of the clock you want to use (usually you can find the CLOCK_* macros in the /usr/include/time.h file). This only works if your system supports clock_gettime(), which most modern unix-like systems do, with the notable exception of OS X.

Why would you want to use a different clock?

Well the default, CLOCK_MONOTONIC, is relatively expensive to call, and NYTProf calls it twice per statement. So it’s the dominant cost of the profiler.

Some systems, like Linux 2.6, offer other clocks, like CLOCK_MONOTONIC_FAST that returns the most recently cached value of the clock. That’s typically just 1/10th the cost of CLOCK_MONOTONIC, so your code runs much faster under the profiler.

Naturally there’s a trade-off: the accuracy of the timings drops significantly. Still far better than Devel::DProf, but far worse than normal. You’re dependent on how often the cached time value gets updated by your kernel. I saw a figure of “600 times per second” quoted for one system, but I can’t find the link now. My advice would be to steer clear of this feature unless you feel comfortable with the issues like these.

Enjoy!

NYTProf 2.04 gives you 90% smaller data files

At OSCON this year I gave a talk on my new pet project Devel::NYTProf v2 to a packed room. Turned out to be a lot of fun.

“The first thing I need to do is talk about Devel::DProf because it needs to be taken out and shot.”

I made a screencast of the 40 minute talk which you can watch on blip.tv here. Worth watching for the background on profilers, the demo of NYTProf, and the questions, not to mention the teasing I get along the way.

One of the final questions was about the size of the profile data file that NYTProf produces. One of the major drawbacks of statement-level profiling is the volume of data it generates while profiling your code. For every statement executed the profiler streams out the file id, the line number, and the time spent. For every statement! When trying to profile a full application doing real work the volume of data generated quickly becomes impractical to deal with. Multi-gigabyte files are common.

This was the major problem with Devel::SmallProf, which generated text files while profiling. Salvador Fandiño García addressed that in Devel::FastProf by writing the data in a compact binary form. A vast improvement that contributed to Devel::FastProf (on which Devel::NYTProf is based) being the first statement-level profiler worth using on large applications. Even so, the volume of data generated was still a problem when profiling all but short running applications.

NYTProf 2.03 was producing profile data at the rate of about 13MB per million statements executed. That might not sound too bad until you realise that on modern systems with cpu intensive code, perl can execute millions of statements every few seconds.

I could see a way to approximately halve the data volume by changing the format to optimize of the common case of consecutive statements being in the same file, but that wasn’t going to be enough. The best way forward would be to add zip compression. It would be easy enough to pipe the output stream through a separate zip process, but that approach has a problem: the zip process will be soaking up cpu time asynchronously from the app being profiled. That would affect the realtime measurements in an unpredictable way.

I realized back in June that a better approach would be to embed zip compression into NYTProf itself. Around the end of July Nicholas Clark, current Perl Pumpkin, got involved and was motivated to implement the internal zipping because he was “generating over 4Gb of profile data trying to profile the harness in the Perl 5 core running tests in parallel“.

He did a great job. The zlib library is automatically detected at build time and, if available, the code to dynamically route i/o through the zip library gets compiled in. The output stream starts in normal mode, so you can easily see and read the plain text headers in the data file, then switches to zip compression for the profile data. How well did it work out? This graph tells the story:

NYTProf 2.04 compression.png

(The data relates to profiling perlcritic running on a portion of its own source code on my MacBook Pre 2GHz laptop. I only took one sample at each compression level so there may be some noise in the results.)

The data file size (red) plummets even at the lowest compression level. Also note the corresponding drop in system time (yellow) due to the reduction in context switches and file i/o.

I’ve set the default compression level to 6. I doubt you’ll want to change it, but you can by adding compression=N to the NYTPROF environment variable.

Here are the change notes for the 2.04 release:

  Fixed rare divide-by-zero error in reporting code.
  Fixed rare core dump in reporting code.
  Fixed detection of #line directives to be more picky.
  Fixed some compiler warnings thanks to Richard Foley.
  Added on-the-fly ~90% zip compression thanks to Nicholas Clark.
    Reduces data file size per million statements executed
    from approx ~13MB to ~1MB (depends on code being profiled).
  Added extra table of all subs sorted by inclusive time.
  No longer warns about '/loader/0x800d8c/...' synthetic file
    names perl assigns reading code from a CODE ref in @INC

Enjoy!