NYTProf v5 – Flaming Precision

As soon as I saw a Flame Graph visualization I knew it would make a great addition to NYTProf. So I’m delighted that the new Devel::NYTProf version 5.00, just released, has a Flame Graph as the main feature of the index page.

nytprof-v5-flamegraph.png

In this post I’ll explain the Flame Graph visualization, the new ‘subroutine calls event stream’ that makes the Flame Graph possible, and other recent changes, including improved precision in the subroutine profiler. Continue reading

NYTProf 4.04 – Came, Saw Ampersand, and Conquered

Please forgive the title!

Perl has three regular expression match variables ( $& $‘ $’ ) which hold the string that the last regular expression matched, the string before the match, and the string after the match, respectively.

As you’re probably aware, the mere presence of any of these variables, anywhere in the code, even if never accessed, will slow down all regular expression matches in the entire program. (See the WARNING at the end of the Capture Buffers section of the perlre documentation for more information.)

Clearly this is not good.
Continue reading

NYTProf v4 – Now with string-eval x-ray vision!

I released Devel::NYTProf v3 on Christmas Eve 2009. Over the next couple of months a few more features were added. The v3 work had involved a complete rewrite of the subroutine profiler and heavy work on much else besides. At that point I felt I’d done enough with NYTProf for now and it was time to focus on other more pressing projects.

Over those months I’d also started working on enhancements for PostgreSQL PL/Perl. That project turned into something of an epic adventure with more than its fair share of highs and lows and twists and turns. The dust is only just settling now. I would have blogged about it but security issues arose that led the PostgreSQL team to consider removing the plperl language entirely. Fortunately I was able to help avoid that by removing Safe.pm entirely! At some point I hope to write a blog post worthy of the journey. Meanwhile, if you’re using PostgreSQL, you really do want to upgrade to the latest point-release.

One of the my goals in enhancing PostgreSQL PL/Perl was improve the integration with NYTProf. I wanted to be able to profile PL/Perl code embedded in the database server. With PostgreSQL 8.4 I could get the profiler to run, with some hackery, but in the report the subroutines were all __ANON__ and you couldn’t see the source code, so there were no statement timings. It was useless.

The key problem was that Devel::NYTProf couldn’t see into string evals properly. To fix that I had to go back spelunking deep in the NYTProf guts again; mostly in the data model and report generation code. With NYTProf v4, string evals are now treated as files, mostly, and a whole new level of insight is opened up!

In the rest of this post I’ll be describing this and other new features.

Continue reading

NYTProf v3 – a sneak peak

I’ve had a great week at OSCON. The talks are excellent but the real value is in the relationships formed and renewed in the “hallway track”. I’m honoured and humbled to be able to call many great people my friends.

My talk on Devel::NYTProf seemed to go well. This year I covered not just NYTProf and the new features in v3 (not yet released) but also added a section on how to use NYTProf to optimize your perl code.

Here’s a quick summary, with links to the slides and screen-cast, and outline what’s still to be done before v3 gets released (getting closer by the day). Continue reading

Has NYTProf helped you? Tell me how…

At OSCON this year1 I’m giving a “State-of-the-art Profiling with Devel::NYTProf” talk. It’ll be an update of the one I gave last year, including coverage of new features added since then (including, hopefully, two significant new features that are in development).

This year I’d like to spend some time talking about how interpret the raw information and using it to guide code changes. Approaches like common sub-expression elimination and moving invariant code out of loops are straight-forward. They’re ‘low hanging fruit’ with no API changes involved. Good for a first-pass through the code.

Moving loops down into lower-level code is an example of a deeper change I’ve found useful. There are many more. I’d like to collect them to add to the talk and the NYTProf documentation.

So here’s a question for you: after looking at the NYTProf report, how did you identify what you needed to do to fix the problems?

I’m interested in your experiences. How you used NYTProf, how you interpreted the raw information NYTProf presented, and then, critically, how you decided what code changes to make to improve performance. What worked, what didn’t. The practice, not the theory.

Could you to take a moment to think back over the times you’ve used NYTProf, the testing strategy you’ve used, and the code changes you’ve made as a result? Ideally go back and review the diffs and commit comments.

Then send me an email — tell me your story!

The more detail the better! Ideally with actual code (or pseudo-code) snippets2.


  1. OSCON is in San Jose this year, July 20-24th. You can use the code ‘os09fos’ to get a 20% discount.
  2. Annotated diff’s would be greatly appreciated. I’ll give credit for any examples used, naturally, and I’ll happily anonymize any code snippets that aren’t open source.

Generate Treemaps for HTML from Perl, please.

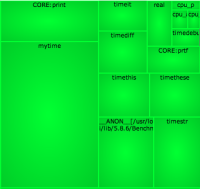
Seeing this video of treemap for perlcritic memory usage reminded me of something…

I’d really like to be able to use treemaps in NYTProf reports to visualize the time spent in different parts, and depths, of the package namespace hierarchy. Currently that information is reported in a series of tables.

A much better interface could be provided by treemaps. Ideally allowing the user to drill-down into deeper levels of the package namespace hierarchy. (It needn’t be this flashy, just 2D would be fine :-)

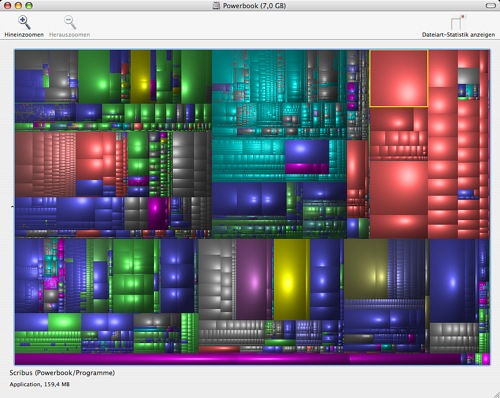
In case you’re not familiar with them, treemaps are a great way to visualise hierarchical data. Here’s an example treemap of the disk space used by the files in a directory tree (from schoschie) 82244D56-FA2C-4044-AE46-EE53B63861BE.jpg

Perl already has a Treemap module, which can generate treemap images via the Imager module. Treemap is designed to support more output formats by sub-classing.

I guess it wouldn’t be hard to write a sub-class to generate HTML client-side image map data along with the image, so clicks on the image could be used to drill-down into treemaps that have more detail of the specific area that was clicked on.

More interesting, and more flexible, would be a sub-class to generate the treemap as a Scalable Vector Graphics diagram using the SVG module (and others).

I’m not going to be able to work on either of those ideas anytime soon.

Any volunteers?

NYTProf 2.09 – now handles modules using AutoLoader, like POSIX and Storable

I’ve uploaded Devel::NYTProf 2.09 to CPAN.

If you’re using VMS the big news is that Peter (Stig) Edwards has contributed patches that enable NYTProf to work on VMS. Yeah! Thanks Peter.

For the rest of us there’s only one significant new feature in this release: NYTProf now includes a heuristic (that’s geek for “it’ll be wrong sometimes”) to handle modules using AutoLoader. The most common of which are Storable and POSIX. You may have encountered a warning like this when running nytprofhtml:

Unable to open '/../../lib/Storable.pm' for reading: No such file or directory

It’s a symptom of a deeper problem caused by AutoSplit, the companion to AutoLoader. The details of the cause, effect, and fix aren’t worth going into now. If you’re interested you can read my summary to the mailing list.

The upshot is that NYTProf now reports times for autoloaded subs as if the sub was part of the parent module. Just what you want. Time spent in the AUTOLOAD’er sub is also reported, naturally.

There is a small chance that the heuristic will pick the wrong ‘parent’ module file for the autoloaded subroutine file. That can happen if there are other modules that use the same name for the last portion of the package name (e.g., Bar::Foo and Baz::Foo). If it ever happens to you, please let me know. Ideally with a small test case.

The list of changes can be found here (or here if you’re a detail fanatic).

One other particularly notable item is that the savesrc option wasn’t working reliably. Thanks to Andy Grundman providing a good test case, that’s now been fixed.

Enjoy!